OpenTelemetryExtension.Configuration
2.1.0
See the version list below for details.
dotnet add package OpenTelemetryExtension.Configuration --version 2.1.0
NuGet\Install-Package OpenTelemetryExtension.Configuration -Version 2.1.0
<PackageReference Include="OpenTelemetryExtension.Configuration" Version="2.1.0" />
<PackageVersion Include="OpenTelemetryExtension.Configuration" Version="2.1.0" />
<PackageReference Include="OpenTelemetryExtension.Configuration" />
paket add OpenTelemetryExtension.Configuration --version 2.1.0
#r "nuget: OpenTelemetryExtension.Configuration, 2.1.0"
#:package OpenTelemetryExtension.Configuration@2.1.0
#addin nuget:?package=OpenTelemetryExtension.Configuration&version=2.1.0
#tool nuget:?package=OpenTelemetryExtension.Configuration&version=2.1.0


Configurable OpenTelemetry setup for .NET applications providing tracing, metrics, and logging via OTLP, configurable through code or appsettings.json.
✨ Features
- One-call setup — tracing, metrics and logging via a single
AddTelemetry(), configured fromappsettings.jsonor code - All three signals over OTLP — HTTP/protobuf or gRPC, to any OTLP-compatible backend
- Built-in instrumentation —
HttpClientand .NET runtime metrics everywhere; ASP.NET Core instrumentation on web targets — each toggleable. Database instrumentation is opt-in via a one-liner (see Databases) - Sensible defaults — configurable sampling, health-check path exclusion and exception recording work out of the box
- Startup validation — misconfiguration fails fast with a clear error
- Extensible —
ConfigureTracing/ConfigureMetrics/ConfigureLogginghooks for custom sources, meters and providers - Works on any .NET — ASP.NET Core, WPF, console and more; the
netstandard2.0build pulls no ASP.NET Core dependencies
✅ Requirements
- A .NET target compatible with
netstandard2.0— i.e. .NET Framework 4.6.1+, .NET 6/8/9/10, or directly thenet8.0/net10.0builds. - An OTLP-compatible backend to receive the telemetry (collector, Jaeger, OpenObserve, the .NET Aspire Dashboard, …). See Running Locally with a Backend.
- ASP.NET Core instrumentation requires a modern .NET target (
net8.0ornet10.0build); it is not included in thenetstandard2.0build used by WPF/console apps.
📦 Installation
dotnet add package OpenTelemetryExtension.Configuration
🚀 Quick Start
1. Register
builder.Services.AddTelemetry(builder.Configuration);
2. Configure (appsettings.json)
{
  "Telemetry": {
    "Endpoint": "http://localhost:4318",
    "ServiceName": "my-api"
  }
}
That's it — tracing, metrics and logging are exported via OTLP.
You need an OTLP-compatible backend listening at
Endpoint. No backend yet? See Running Locally with a Backend for one-command setups.
⚙️ Configuration
All options live under the Telemetry key in appsettings.json.
| Property | Type | Default | Description |
|---|---|---|---|
Enabled |
bool |
true |
Set to false to disable telemetry (no OpenTelemetry services are registered). |
Endpoint |
Uri |
(required) | OTLP collector endpoint, e.g. http://localhost:4318. |
Headers |
string |
"" |
Exporter headers. Format: key1=value1,key2=value2. |
Protocol |
string |
HttpProtobuf |
HttpProtobuf (port 4318) or Grpc (port 4317). |
ServiceName |
string? |
null |
Service name shown in the backend. |
ResourceAttributes |
object |
{} |
Extra resource attributes, e.g. { "deployment.environment": "production", "team": "backend" }. |
AdditionalTracingSources |
string[] |
[] |
Extra ActivitySource names to collect (e.g. "Npgsql", your own app sources) — registered via AddSource. |
AdditionalMeters |
string[] |
[] |
Extra Meter names to collect (e.g. "MyApp.Orders") — registered via AddMeter. |
SampleRatio |
double |
1.0 |
Fraction of traces to sample. 0.1 = 10%, 1.0 = all. |
EnableTracing |
bool |
true |
Enables distributed tracing. |
EnableMetrics |
bool |
true |
Enables metrics collection. |
EnableLogging |
bool |
true |
Enables log export via OTLP. |
EnableAspNetCoreInstrumentation |
bool |
true |
Instruments incoming HTTP requests. |
EnableHttpClientInstrumentation |
bool |
true |
Instruments outgoing HttpClient requests. |
EnableRuntimeInstrumentation |
bool |
true |
Collects GC, memory and thread pool metrics. |
RecordExceptions |
bool |
true |
Records exception stack traces on spans. |
ExcludedPaths |
string[] |
["/health"] |
Paths excluded from tracing. |
IncludeScopes |
bool |
true |
Includes log scopes in exported log records. |
IncludeFormattedMessage |
bool |
true |
Includes the formatted message in exported log records. |
ConfigureTracing,ConfigureMetricsandConfigureLoggingare code-only callbacks — see Code configuration.For every key with its default value, see the Full configuration reference below.
Custom section name
The section defaults to Telemetry, but you can bind any section by passing its name:
builder.Services.AddTelemetry(builder.Configuration, "MyTelemetry");
// or together with a code callback:
builder.Services.AddTelemetry(builder.Configuration, o => { /* ... */ }, "MyTelemetry");
{
  "MyTelemetry": {
    "Endpoint": "http://localhost:4318",
    "ServiceName": "my-api"
  }
}
🧩 Code Configuration
Configure entirely in code instead of appsettings.json:
builder.Services.AddTelemetry(o =>
{
    o.Endpoint        = new Uri("http://localhost:4318");
    o.ServiceName     = "my-api";
    o.ResourceAttributes = new() { ["deployment.environment"] = "production" };
    o.SampleRatio     = 0.1;

    // Code-only: register additional instrumentation
    o.ConfigureTracing = tracing => tracing.AddSource("MyApp");
    o.ConfigureMetrics = metrics => metrics.AddMeter("MyApp");
    o.ConfigureLogging = logging => logging.AddConsole();
});
Or bind appsettings.json first and layer code-only options on top — both
sources are combined, and bound values can still be overridden in the callback:
builder.Services.AddTelemetry(builder.Configuration, o =>
{
    // Everything from appsettings.json is already bound here.
    o.ConfigureTracing = tracing => tracing.AddSource("MyApp");
    o.ConfigureMetrics = metrics => metrics.AddMeter("MyApp");
    o.ConfigureLogging = logging => logging.AddConsole();
});
The Configure* hooks — Sources & Meters
The three callbacks are the extension points for your own telemetry. The
built-in instrumentation (ASP.NET Core, HttpClient, SQL, runtime) is wired up
automatically; these hooks let you add the signals your application emits itself.
| Hook | Builder | Used to register |
|---|---|---|
ConfigureTracing |
TracerProviderBuilder |
Activity Sources via AddSource("Name") |
ConfigureMetrics |
MeterProviderBuilder |
Meters via AddMeter("Name") |
ConfigureLogging |
ILoggingBuilder |
extra logging providers, filters, etc. |
What is a Meter?
A Meter
(from System.Diagnostics.Metrics) is the factory you create instruments
(counters, histograms, gauges) from. Each Meter has a name, and OpenTelemetry
only collects metrics from meters you have explicitly registered with
AddMeter("That.Name"). Without that call, your custom metrics are never exported.
// 1. Create a Meter and an instrument somewhere in your app
private static readonly Meter Meter = new("MyApp.Orders");
private static readonly Counter<long> OrdersPlaced = Meter.CreateCounter<long>("orders.placed");

// ... later
OrdersPlaced.Add(1);

// 2. Register the meter's name so it gets exported
o.ConfigureMetrics = metrics => metrics.AddMeter("MyApp.Orders");
What is a Source?
An ActivitySource
is the tracing equivalent: it creates Activity objects (= spans). Register its
name with AddSource("MyApp") so your custom spans are sampled and exported.
private static readonly ActivitySource Activity = new("MyApp");

using var span = Activity.StartActivity("ProcessOrder");
// ... work being traced

o.ConfigureTracing = tracing => tracing.AddSource("MyApp");
The string passed to
AddMeter/AddSourcemust exactly match the name you gave theMeter/ActivitySource— that name is how OpenTelemetry routes the data.
Databases
Database instrumentation is not built in — it depends entirely on your
driver, so it is added through the ConfigureTracing hook. This keeps the
package free of database-specific dependencies; you only pull in what you use.
// SQL Server — install the package, then register it:
//   dotnet add package OpenTelemetry.Instrumentation.SqlClient
o.ConfigureTracing = t => t.AddSqlClientInstrumentation();

// EF Core — dedicated instrumentation package:
//   dotnet add package OpenTelemetry.Instrumentation.EntityFrameworkCore
o.ConfigureTracing = t => t.AddEntityFrameworkCoreInstrumentation();

// Drivers with a built-in ActivitySource — just register its name:
o.ConfigureTracing = t => t.AddSource("Npgsql");          // PostgreSQL (Npgsql)
o.ConfigureTracing = t => t.AddSource("MySqlConnector");  // MySQL (MySqlConnector)
Oracle (Oracle.ManagedDataAccess.Core) emits an ActivitySource in recent
versions and is wired up the same way via AddSource(...).
No code for source-based drivers: if the driver only needs an ActivitySource
name (Npgsql, MySqlConnector, Oracle, your own app sources), you can enable it
purely from appsettings.json — no ConfigureTracing call required:
{
  "Telemetry": {
    "Endpoint": "http://localhost:4318",
    "AdditionalTracingSources": [ "Npgsql", "MyApp" ],
    "AdditionalMeters": [ "MyApp.Orders" ]
  }
}
Package-based instrumentation (SQL Server, EF Core) still needs the one-line
ConfigureTracingcall above, because it requires its NuGet package — a config string alone can't pull in a dependency.
Toggling SQL instrumentation from appsettings.json
Because EnableSqlClientInstrumentation is not part of TelemetryOptions (the
package is optional), you can add it as a custom key and read it in the callback:
appsettings.json:
{
  "Telemetry": {
    "Endpoint": "http://localhost:4318",
    "ServiceName": "my-api",
    "EnableSqlClientInstrumentation": true
  }
}
Program.cs:
builder.Services.AddTelemetry(builder.Configuration, opt =>
    opt.ConfigureTracing = tracing =>
    {
        if (builder.Configuration.GetValue<bool>("Telemetry:EnableSqlClientInstrumentation"))
        {
            // Microsoft SQL Server / System.Data.SqlClient
            // NuGet: OpenTelemetry.Instrumentation.SqlClient
            tracing.AddSqlClientInstrumentation(sql => sql.RecordException = opt.RecordExceptions);

            // PostgreSQL (Npgsql)
            // NuGet: OpenTelemetry.Instrumentation.Npgsql
            tracing.AddNpgsql();

            // MySQL (MySqlConnector)
            // NuGet: OpenTelemetry.Instrumentation.MySqlData
            tracing.AddMySqlDataInstrumentation();
        }
    });
This keeps the on/off switch in config while the package dependency stays explicit in code.
🖥️ Using outside the Generic Host
AddTelemetry() works with any IServiceCollection — ASP.NET Core, WPF,
WinForms, console, MAUI/WinUI, UWP, worker services, etc.
With the Generic Host (recommended for desktop/console — Host.CreateApplicationBuilder()),
the providers start and flush automatically:
var builder = Host.CreateApplicationBuilder(args);
builder.Services.AddTelemetry(builder.Configuration);
using var host = builder.Build();
await host.RunAsync();   // telemetry starts here and flushes on shutdown
Without a host (e.g. a bare ServiceCollection in UWP or a minimal app),
build the provider and dispose it on exit so buffered telemetry is flushed:
var services = new ServiceCollection();
services.AddTelemetry(o =>
{
    o.Endpoint    = new Uri("http://localhost:4318");
    o.ServiceName = "my-desktop-app";
});

var provider = services.BuildServiceProvider();
// ... app runs ...
provider.Dispose();      // flushes traces, metrics and logs
ASP.NET Core instrumentation is only in the
net10.0build. On thenetstandard2.0build (WPF/WinForms/console/UWP) it is simply absent — settingEnableAspNetCoreInstrumentationthere is a harmless no-op.
📋 Full Configuration Reference
Every key with its default value (only Endpoint is required to get started — telemetry is enabled by default):
{
  "Telemetry": {
    "Enabled": true,                           // master switch — set false to disable
    "Endpoint": "http://localhost:4318",       // OTLP collector endpoint (required)
    "Headers": "",                             // exporter headers: "key1=value1,key2=value2"
    "Protocol": "HttpProtobuf",                // "HttpProtobuf" (4318) or "Grpc" (4317)
    "ServiceName": null,                        // service name shown in the backend
    "ResourceAttributes": {},                   // extra attributes, e.g. { "deployment.environment": "production" }
    "AdditionalTracingSources": [],             // extra ActivitySource names, e.g. [ "Npgsql", "MyApp" ]
    "AdditionalMeters": [],                     // extra Meter names, e.g. [ "MyApp.Orders" ]
    "SampleRatio": 1.0,                         // 0.1 = 10% of traces, 1.0 = all
    "EnableTracing": true,                      // distributed tracing
    "EnableMetrics": true,                      // metrics collection
    "EnableLogging": true,                      // log export via OTLP
    "EnableAspNetCoreInstrumentation": true,    // incoming HTTP requests
    "EnableHttpClientInstrumentation": true,    // outgoing HttpClient requests
    "EnableRuntimeInstrumentation": true,       // GC, memory, thread pool metrics
    "RecordExceptions": true,                   // exception stack traces on spans
    "ExcludedPaths": [ "/health" ],             // paths excluded from tracing
    "IncludeScopes": true,                      // log scopes in exported records
    "IncludeFormattedMessage": true             // formatted message in exported records
  }
}
🧪 Samples
Two runnable samples live under src/:
| Sample | Project | Demonstrates |
|---|---|---|
| Web API | …Sample.WebApi |
ASP.NET Core minimal API configured from appsettings.json, ready-to-run backend profiles, EF Core and opt-in SQL instrumentation. |
| WPF | …Sample.Wpf |
Desktop app wiring AddTelemetry() through the Generic Host, emitting a custom ActivitySource/Meter and an HttpClient span on a button click. |
The Web API sample drives the backend walkthrough below; the WPF sample exports
to http://localhost:4318 by default — point it at any of the backends here.
🔌 Running Locally with a Backend
The Web API sample ships
ready-to-run configurations for several popular backends (the three below are
documented in full; more start scripts live in infrastructure/). Each backend has:
- an infrastructure start script (Docker Compose or Helm) in
infrastructure/, - a launch profile that selects the matching
appsettings.<env>.json, - a UI where the exported traces, metrics and logs show up.
Steps
- Start the backend infrastructure — run the script for your backend (see table).
- Docker scripts live in
infrastructure/dockerand need Docker. - Helm scripts live in
infrastructure/helmand need a local Kubernetes cluster (e.g. k3s in WSL2).
- Docker scripts live in
- Run the sample with the matching profile:
Or pick the profile from the run dropdown in Visual Studio / Rider.cd src/OpenTelemetryExtension.Configuration.Sample.WebApi dotnet run --launch-profile "Start Aspire" - Generate traffic — the app opens Swagger at
https://localhost:5073/swagger; call an endpoint. - Open the backend UI (see table) to inspect the telemetry.
Backend overview
| Backend | Start infrastructure | Launch profile | Backend UI |
|---|---|---|---|
| .NET Aspire Dashboard | infrastructure/docker/docker-install-aspire-dashboard.cmd (or Helm: helm/helm-install-aspire-dashboard.cmd) |
Start Aspire |
http://localhost:31888 |
| Jaeger | infrastructure/docker/docker-install-jaeger.cmd |
Start Jaeger |
http://localhost:16686 |
| OpenObserve | infrastructure/helm/helm-install-openobserve.cmd |
Start OpenObserve Http / Start OpenObserve Grpc |
http://localhost:30117 (admin@web.de/admin) |
Tip — viewing logs in the Aspire Dashboard: after starting the app with the
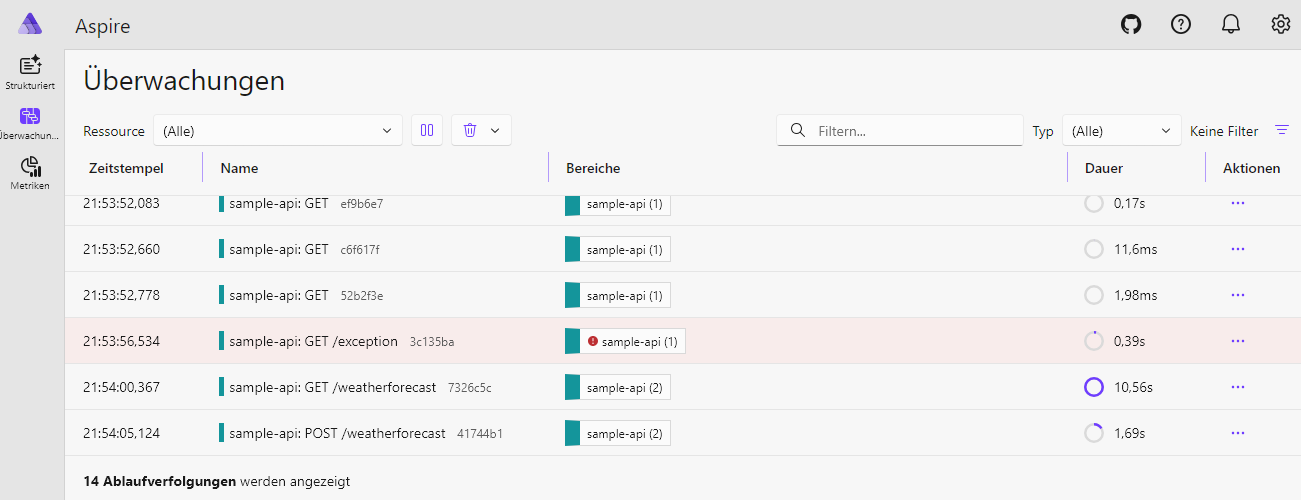
Start Aspireprofile, open http://localhost:31888, then go to the Structured (logs), Traces or Metrics tab. Data appears as soon as you hit a Swagger endpoint.
📝 Sample Backend Configurations
These are the exact appsettings.<env>.json files used by the sample's launch profiles.
.NET Aspire Dashboard — appsettings.aspire.json
The dashboard requires an API key on the OTLP endpoint (x-otlp-api-key). The
gRPC endpoint is exposed on NodePort 31889 (Helm) or host port 31889 (Docker).
{
  "Telemetry": {
    "Protocol": "Grpc",
    "Endpoint": "http://localhost:31889",
    "Headers": "x-otlp-api-key=aspire"
  }
}
Traces, metrics and logs from the sample app shown live in the Aspire Dashboard UI:
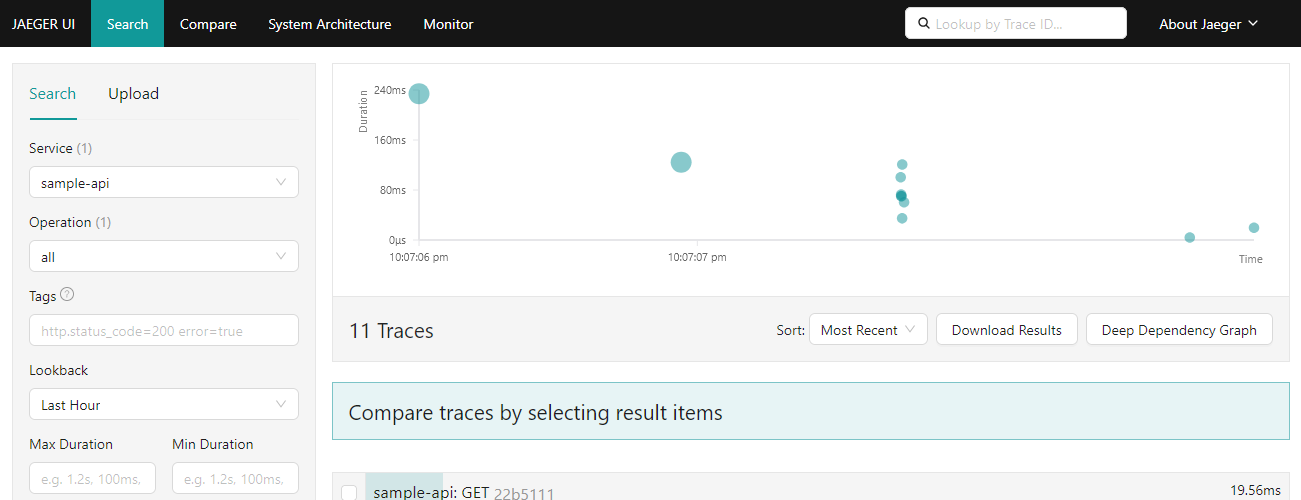
Jaeger — appsettings.jaeger.json
{
  "Telemetry": {
    "Protocol": "Grpc",
    "Endpoint": "http://localhost:4317"
  }
}
Traces from the sample app shown in the Jaeger UI:
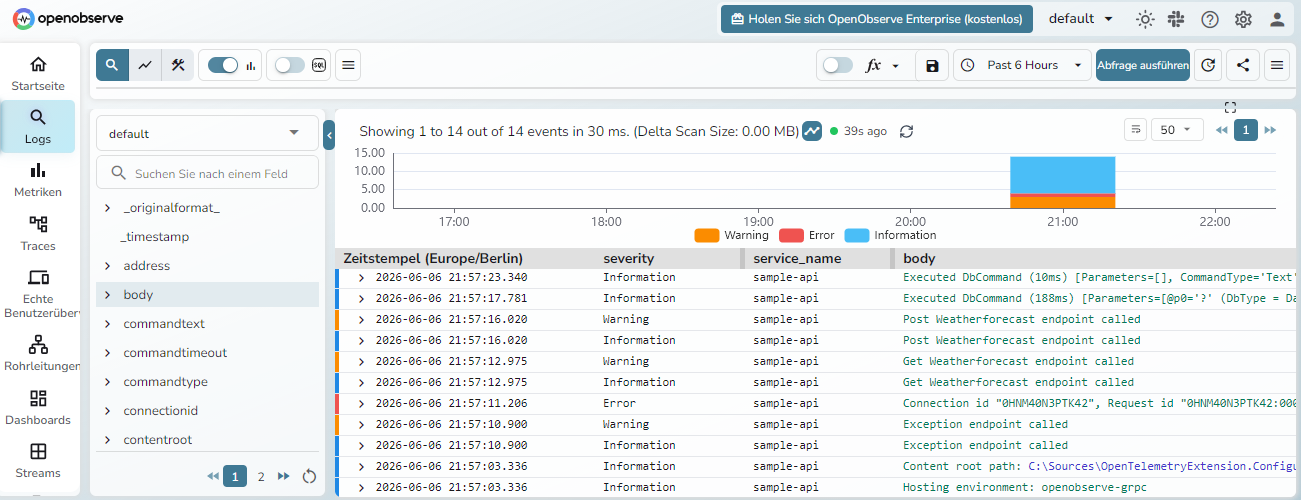
OpenObserve — HTTP/protobuf — appsettings.openobserve-http.json
{
  "Telemetry": {
    "Protocol": "HttpProtobuf",
    "Endpoint": "http://localhost:30117/api/default",
    "Headers": "Authorization=Basic YWRtaW5Ad2ViLmRlOmFkbWlu,stream-name=default"
  }
}
The same telemetry explored in the OpenObserve UI:
📚 References
- OpenTelemetry .NET — official docs · GitHub
- .NET observability (Microsoft Learn) — Metrics · Distributed tracing · Logging
- APIs —
Meter·ActivitySource - OTLP exporter — configuration reference · environment variables
🤝 Contributing
See CONTRIBUTING.md.
🐛 Report a Bug
| Product | Versions Compatible and additional computed target framework versions. |
|---|---|
| .NET | net5.0 was computed. net5.0-windows was computed. net6.0 was computed. net6.0-android was computed. net6.0-ios was computed. net6.0-maccatalyst was computed. net6.0-macos was computed. net6.0-tvos was computed. net6.0-windows was computed. net7.0 was computed. net7.0-android was computed. net7.0-ios was computed. net7.0-maccatalyst was computed. net7.0-macos was computed. net7.0-tvos was computed. net7.0-windows was computed. net8.0 is compatible. net8.0-android was computed. net8.0-browser was computed. net8.0-ios was computed. net8.0-maccatalyst was computed. net8.0-macos was computed. net8.0-tvos was computed. net8.0-windows was computed. net9.0 was computed. net9.0-android was computed. net9.0-browser was computed. net9.0-ios was computed. net9.0-maccatalyst was computed. net9.0-macos was computed. net9.0-tvos was computed. net9.0-windows was computed. net10.0 is compatible. net10.0-android was computed. net10.0-browser was computed. net10.0-ios was computed. net10.0-maccatalyst was computed. net10.0-macos was computed. net10.0-tvos was computed. net10.0-windows was computed. |
| .NET Core | netcoreapp2.0 was computed. netcoreapp2.1 was computed. netcoreapp2.2 was computed. netcoreapp3.0 was computed. netcoreapp3.1 was computed. |
| .NET Standard | netstandard2.0 is compatible. netstandard2.1 was computed. |
| .NET Framework | net461 was computed. net462 was computed. net463 was computed. net47 was computed. net471 was computed. net472 was computed. net48 was computed. net481 was computed. |
| MonoAndroid | monoandroid was computed. |
| MonoMac | monomac was computed. |
| MonoTouch | monotouch was computed. |
| Tizen | tizen40 was computed. tizen60 was computed. |
| Xamarin.iOS | xamarinios was computed. |
| Xamarin.Mac | xamarinmac was computed. |
| Xamarin.TVOS | xamarintvos was computed. |
| Xamarin.WatchOS | xamarinwatchos was computed. |
-
.NETStandard 2.0
- OpenTelemetry.Exporter.OpenTelemetryProtocol (>= 1.16.0)
- OpenTelemetry.Extensions.Hosting (>= 1.16.0)
- OpenTelemetry.Instrumentation.Http (>= 1.15.1)
- OpenTelemetry.Instrumentation.Runtime (>= 1.15.1)
-
net10.0
- OpenTelemetry.Exporter.OpenTelemetryProtocol (>= 1.16.0)
- OpenTelemetry.Extensions.Hosting (>= 1.16.0)
- OpenTelemetry.Instrumentation.AspNetCore (>= 1.15.2)
- OpenTelemetry.Instrumentation.Http (>= 1.15.1)
- OpenTelemetry.Instrumentation.Runtime (>= 1.15.1)
-
net8.0
- OpenTelemetry.Exporter.OpenTelemetryProtocol (>= 1.16.0)
- OpenTelemetry.Extensions.Hosting (>= 1.16.0)
- OpenTelemetry.Instrumentation.AspNetCore (>= 1.15.2)
- OpenTelemetry.Instrumentation.Http (>= 1.15.1)
- OpenTelemetry.Instrumentation.Runtime (>= 1.15.1)
NuGet packages
This package is not used by any NuGet packages.
GitHub repositories
This package is not used by any popular GitHub repositories.